 ViewGraph
The first week is a search problem
On my first day on a new iOS team I cloned the repo and did what everyone does: built it, ran it, and started tapping around. The app worked. I still had no idea how it was put together. Nobody hands you a map, and the README explains how to build the app, not how it is structured.
What I actually needed to answer was small and specific. Which screens exist? Which ones can reach each other, and through what — a push, a sheet, a full-screen cover? Which view is the one heavy component on the settings screen, and where else is it used? If I change this component, what breaks visually?
That's a graph of screens and components. I just couldn't see it.
The workflow I used
It goes roughly like this, and it's slow in a way that's hard to notice because each step is small:
- Search the file tree for names I don't know yet, guessing at prefixes and folders.
- Open a possible screen file and read until I find the
body. - Jump-to-definition on a subview, land in another file, jump again. Keep a stack in my head.
- Hunt for navigation: grep
NavigationLink,.sheet,navigationDestinationand hope the destination is literal. - Write the graph on paper, then discover it's wrong when the app pushes somewhere I missed.
- Repeat the next day because I forgot half of it.
The painful part isn't any single step. It's that the answers live in different tools — the file tree, the editor's jump history, the running app, and grep — and none of them gives me the whole shape. Reuse is especially invisible: a component used by eleven screens looks exactly like a component used by one.
The workflow with a graph
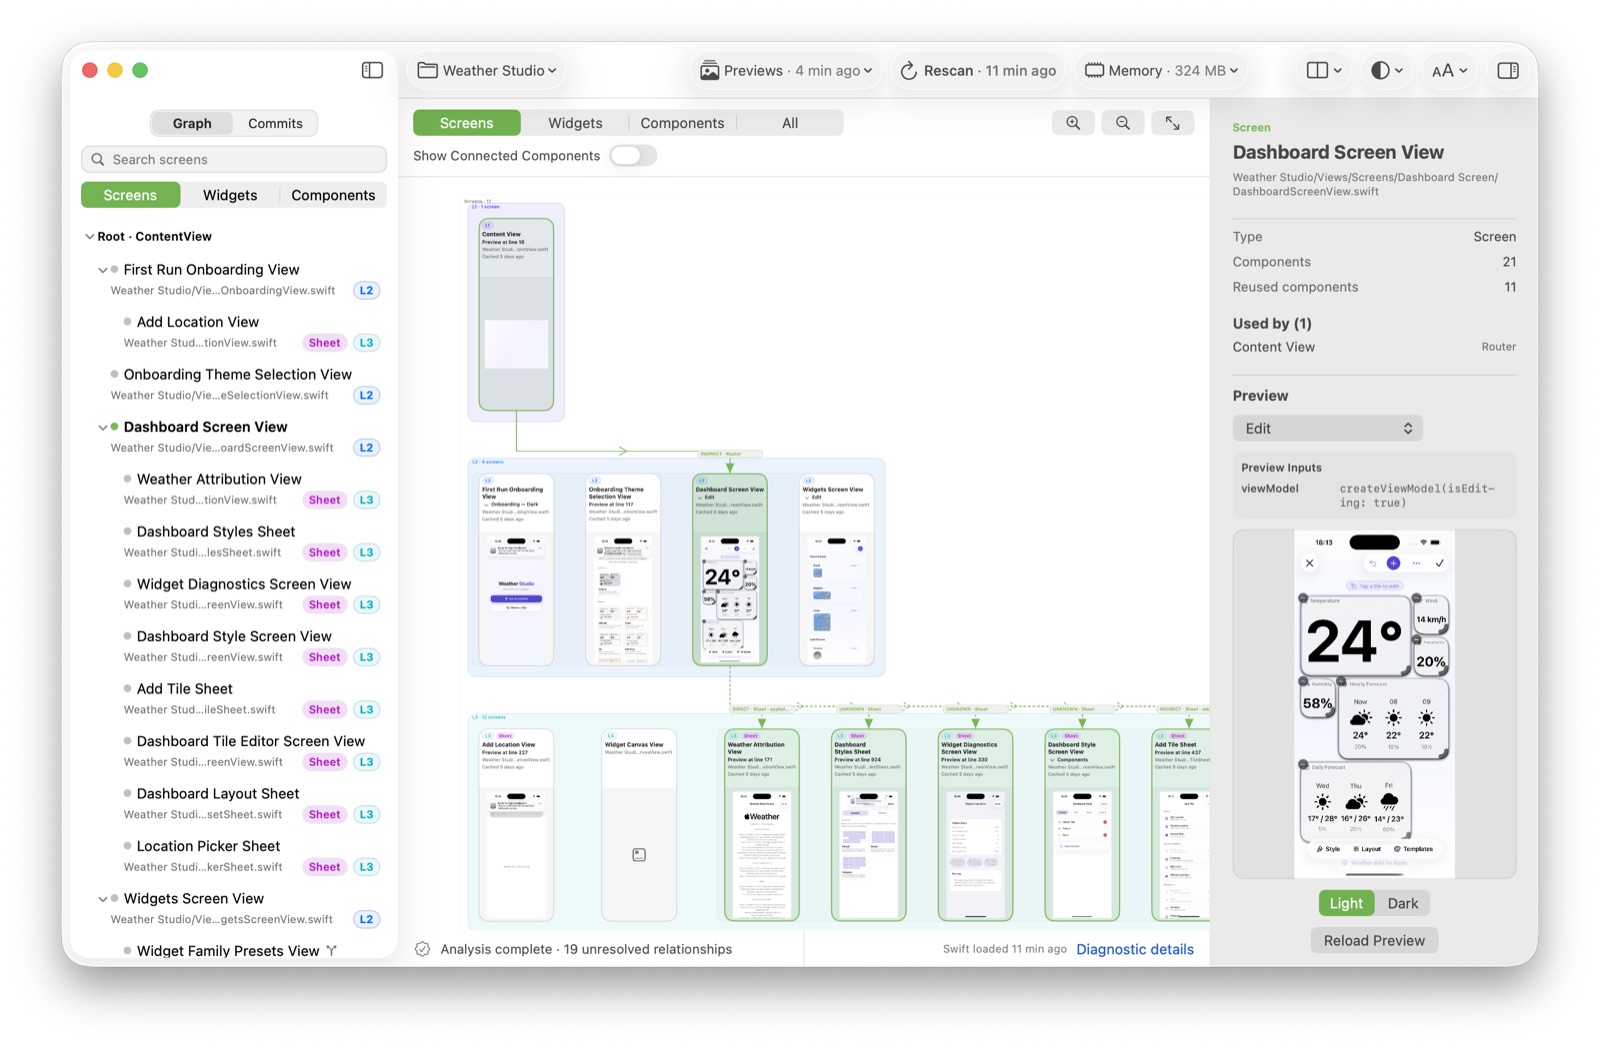
Now I open the project in ViewGraph and let it analyze. I get one canvas with the screens laid out by navigation level: the app root on the left, the screens it reaches next, and so on. The connections between them are things like direct, sheet and full-screen cover, so the flow is visible without reading each call site.
Then I stop reading and start selecting. Selecting a screen shows the components it is built from. Selecting a component highlights every screen that reuses it. Previews that already exist in the project are attached to the graph, so a screen I haven't run yet still has a face.
Before and after, concretely
The clearest way to show the difference is to pick one question and
answer it both ways. "Where is DashboardBackgroundView
used?" was a real one for me.
Before
- grep the type name across the repo.
- Filter out the declaration and the previews.
- Open each remaining hit, decide whether it's a real usage, and remember the screen it belongs to.
- Do it again later because the answer wasn't written down anywhere durable.
After
- Switch the canvas to Components.
- Select
DashboardBackgroundView. - Read the screens it connects to; the graph shows reuse as edges, not a text list.
The second version is faster, but the more important difference is that it's complete for the same model. The graph was built from the whole project, so I'm not relying on my grep terms or my memory of which folder I already searched.
Where this stops being useful
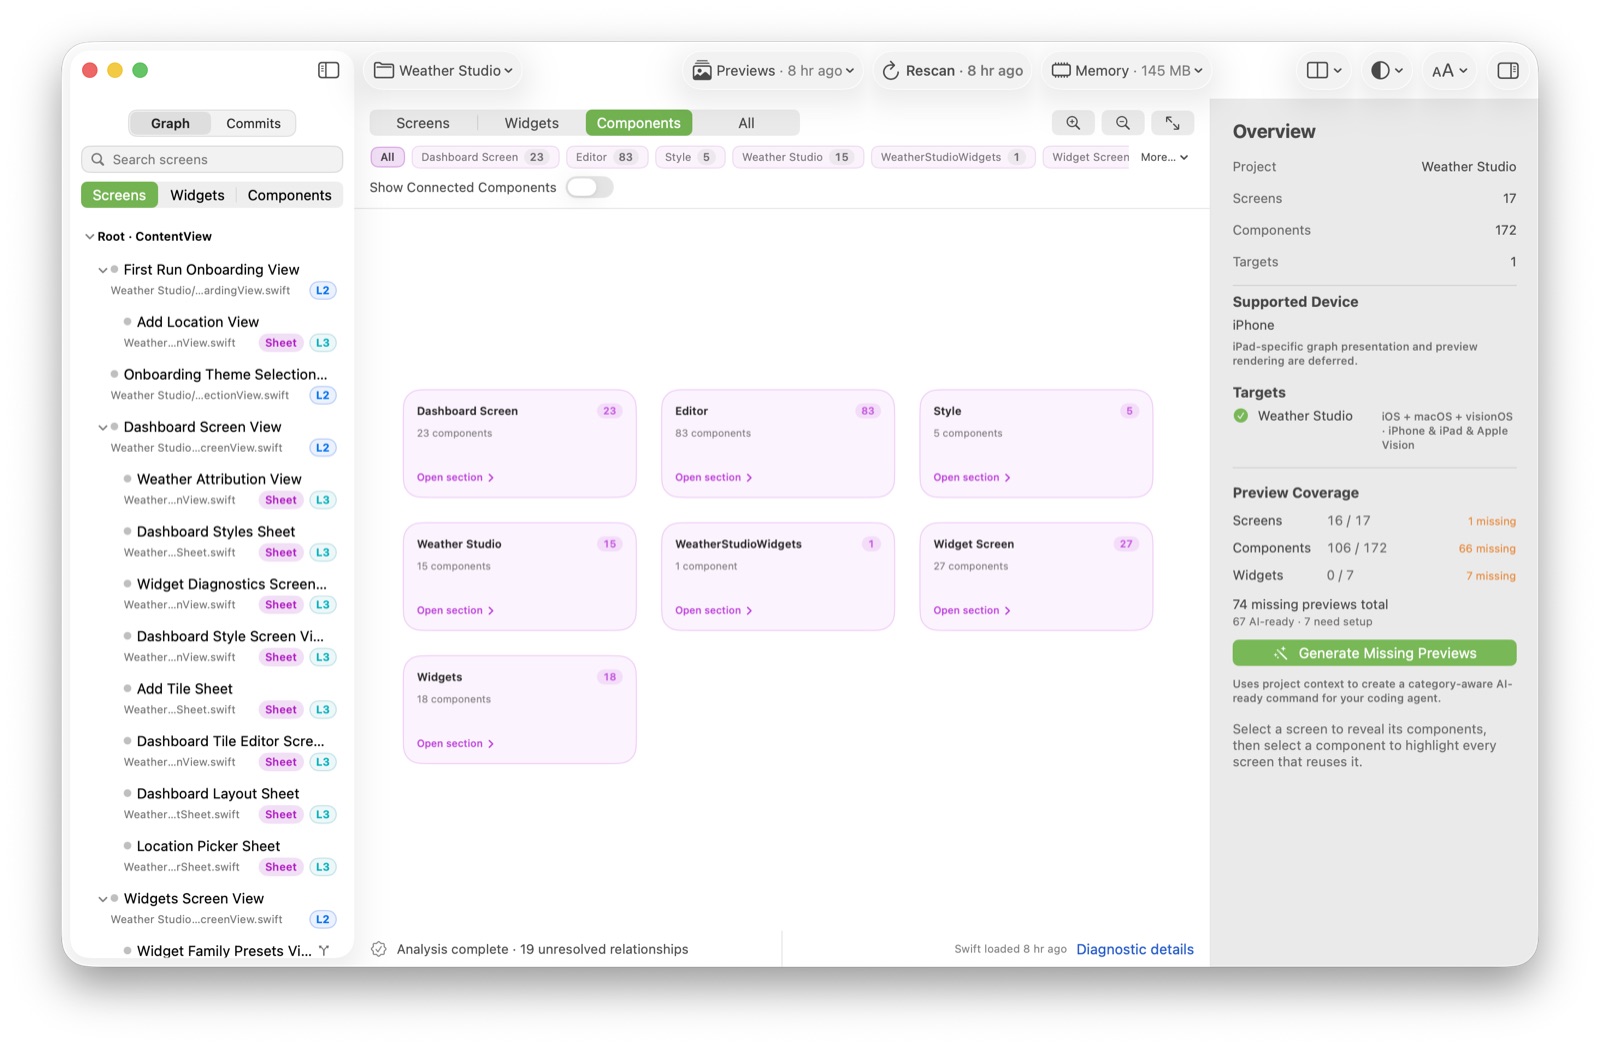
I want to be precise, because a map you over-trust is worse than no map. ViewGraph analyzes Swift source statically. It can see what the compiler can see, and it says so when it can't: my own sessions show a line like "analysis complete — 19 unresolved relationships". Those are the connections it could not pin down, usually because the destination is computed at runtime.
It also doesn't replace running the app. Some behaviour only exists at runtime — data-driven navigation, states that depend on a network response, anything behind a feature flag. ViewGraph narrows the surface I have to explore by hand; it doesn't remove the need to explore.
Finally, previews need Xcode and the iOS Simulator. Without a working toolchain the graph and Git history still work, but the previews tell you the toolchain is unavailable instead of guessing.
What I'd write next
This is the first piece in a Use Cases series. The same workflow applies to a few other situations I keep running into:
- Returning to an old project. The map you built a year ago is gone; the graph isn't.
- Adopting a purchased template. You inherit someone else's structure with no onboarding.
- Reviewing changes. Understanding which screens a pull request touches before reading the diff.
- Working with AI. Giving an assistant (and yourself) an accurate overview to reason against.
If you're in the middle of an unfamiliar SwiftUI codebase right now, the part I'd try first is the component-reuse question. It's the one that source browsing answers worst.
See your own project as a graph
ViewGraph 0.1.0-alpha.2 is a pre-release alpha for macOS. Open a SwiftUI project and it draws the graph locally, with no telemetry.